Australia’s property market has always attracted investors, but the past decade has taken things to another level. Property investor activity has almost doubled, jumping from $23 billion in 2015 to a record $39 billion between September 2015 and 2025¹. As a result of this shift, investors now make up over 40% of all property transactions nationwide¹.
Throughout 2025, records were broken across our capitals and key regions. If you’re thinking of making your first property investment, or expanding your portfolio in 2026, then understanding what’s driving the market is more important than ever.
Where is the most property investment activity?
Growth is no longer limited to the usual suspects, like Sydney and Melbourne. While Sydney still holds the crown as the nation’s most expensive property market², the standout performer in 2025 was Darwin, which saw prices increase by 17% across the year².
For borrowers, this shift means opportunities aren’t confined to one or two cities, or even just the eastern states anymore. If you’re thinking about investing, the growth story is now spread more widely across the country, providing opportunities for geographical diversification.
Annual change in dwelling values
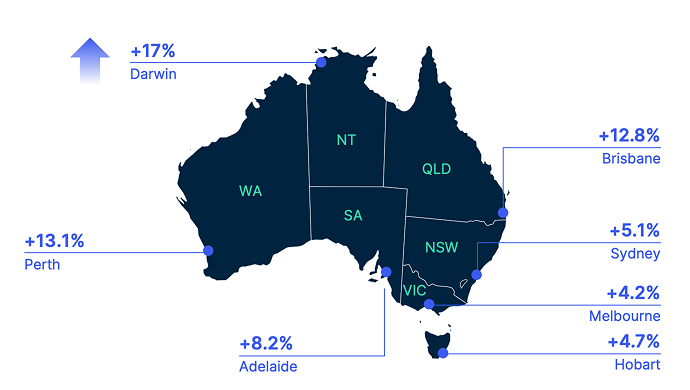
Cotality Monthly Housing Charts, December 2025
Are prices still rising?
A big part of the fuel behind price growth comes down to supply constraints. Listings are 18.3% below the five‑year average and 14% lower than they were a year ago (as at December 2025)¹. This is where base supply and demand principles come into play; as fewer properties are available, competition increases, which can put upward pressure on prices.
Prices may continue to rise in capacity constrained cities or regions without the room to increase existing density levels.
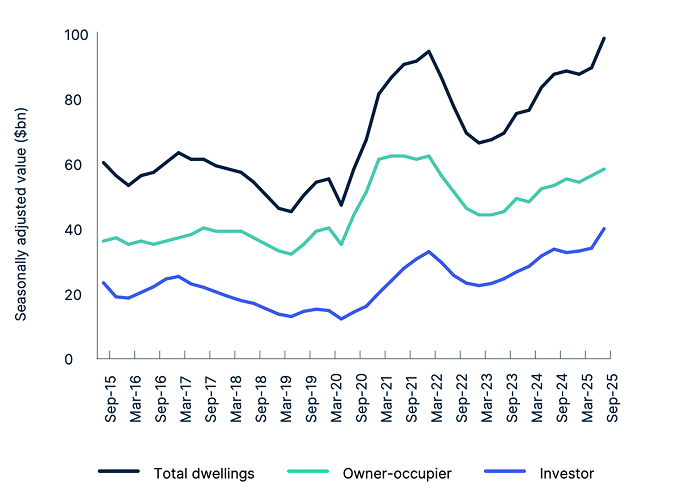
New Loan Commitments, ABS Lending Indicators, September Quarter 2025
Understanding rental yields
Rental yield is one of the simplest ways to get a feel for an investment’s potential return, calculated as the ratio of rental income to the property’s purchase price. For example:
- A $1,000,000 property generating $50,000 a year has a 5% gross rental yield
- A $500,000 property generating the same income has a 10% gross yield
This is what causes investors to look for areas with strong rental incomes relative to asset purchase prices, which explains why Darwin has seen a surge in investor demand throughout 2025. The Northern Territory capital’s relatively ‘affordable’ asset prices in relation to a buoyant rental market has seen it awarded Australia’s best-performing rental yield at 6.2%².
Even though headline rents rose in 2025 — up 6.2% in regional markets and 4.5% in capital cities² — yields have softened, with the gross national yield sitting at 3.6%². This is largely due to house prices rising faster than rents.
For borrowers, this highlights the importance of balancing purchase price, rental income and long‑term plans. Yield doesn’t tell the whole story, but it can be a useful way to compare options across different markets.
Gross rental yields (September 2025)
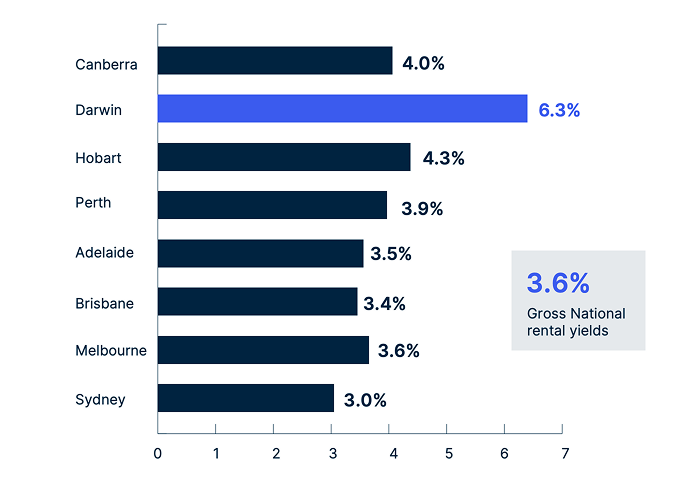
Cotality Monthly Housing Charts, December 2025
How many property investors are there?
According to ABS data, in the September 2025 quarter, new investor loan commitments grew 13.6%¹. That’s more than six times the rate of owner‑occupier loans, which grew 2% over the same period¹.
Across almost every region, investors now make up a significant share of the market, often above the 10‑year averages. Areas like the Northern Territory and Western Australia stand out for their strong investor activity, suggesting many buyers see potential for further growth.
What this means in 2026
The market is changing, but that doesn’t need to feel overwhelming. Whether you’re exploring your first investment property or building your existing portfolio, the right support can make a big difference.
At Bluestone, we look beyond the traditional lending boxes. We understand that an individual’s situation isn’t always straightforward, and we’re here to help you take the next step with clarity and confidence.
¹ABS Lending Indicators, September Quarter 2025
²Cotality Monthly Housing Charts, December 2025
The information provided in this article is general in nature and has been prepared without considering your requirements, objectives or financial situation. Bluestone Home Loans are administered by Bluestone Servicing Pty Ltd ACN 122 698 328, Australian Credit Licence 390183 on behalf of the Credit Provider, Permanent Custodians Ltd ACN 001 426 384. All loans are subject to suitability and credit assessment. Fees, terms, conditions, and lending criteria apply.
